
We have now had bird recorders in Oakley Wood for two years, and I’ve been “crunching the numbers” to find out what they may have to say about bird population.
To briefly recap: we have two fairly crude home-made recorders that record for a few minutes every half hour onto SD cards, and these get taken home from time to time and processed through bird recognition software. The analytical software comes from the same stable as Merlin, the well-known phone app. In total we’ve amassed around 89,000 detections in 1200 hours of recordings over nearly two years from 13 different sites in the wood, which is why identifications cannot be done manually!
AI bird recognition isn’t foolproof by any means, and the results need some human post-processing to avoid the worst errors. The Song Thrush, with its fantastic range of notes and sounds, gives the software a particularly hard time. It usually identifies this bird correctly, but also variously as Lapwing, Teal, Golden Plover, Water Rail, Bullfinch, Greenshank and possibly others I’ve not spotted. The Blackbird also has a rich repertoire and sometimes gets mis-identified as Pied Flycatcher, Curlew and Redwing.
The latter – Blackbird misidentified as Redwing – is problematic. Redwing are winter visitors, so detections of them in the summer are almost certainly Blackbird, but in the winter they could be either. How to deal with this? We do have visual confirmation of Redwing in the wood at this time so I took a pragmatic approach and divided them equally. This is just one example of how AI identification is not without issues.
The initial purpose of the recorders was to discover what species of bird may be present in the wood that we weren’t aware of. It’s pretty much done that for us now – it alerted us to Crossbill and Woodcock (both now confirmed) and confirmed the on-going presence of less often noticed birds such as Siskin, Garden Warbler, Marsh Tit and Spotted Flycatcher (the latter already alerted by Merlin). But the wealth of data from different locations in the wood should also allow us to get an idea of the distribution of species throughout the wood.
Analysis
We have to recognise that there is a big assumption being made in interpreting the frequency of detections as being proportional to population. For example, it could be the same bird or birds being detected all the time, perhaps because the recorder was close to a nest. This could account for some of the large detection rates for some species at some locations, but on average, hopefully, this won’t be the case and assumption is reasonable.
To take into account the fact that the recorders did not spend the same amount of time at each location, the detections for each were “normalised” from an absolute number to detections per hour. This allows detections from each location to be compared.
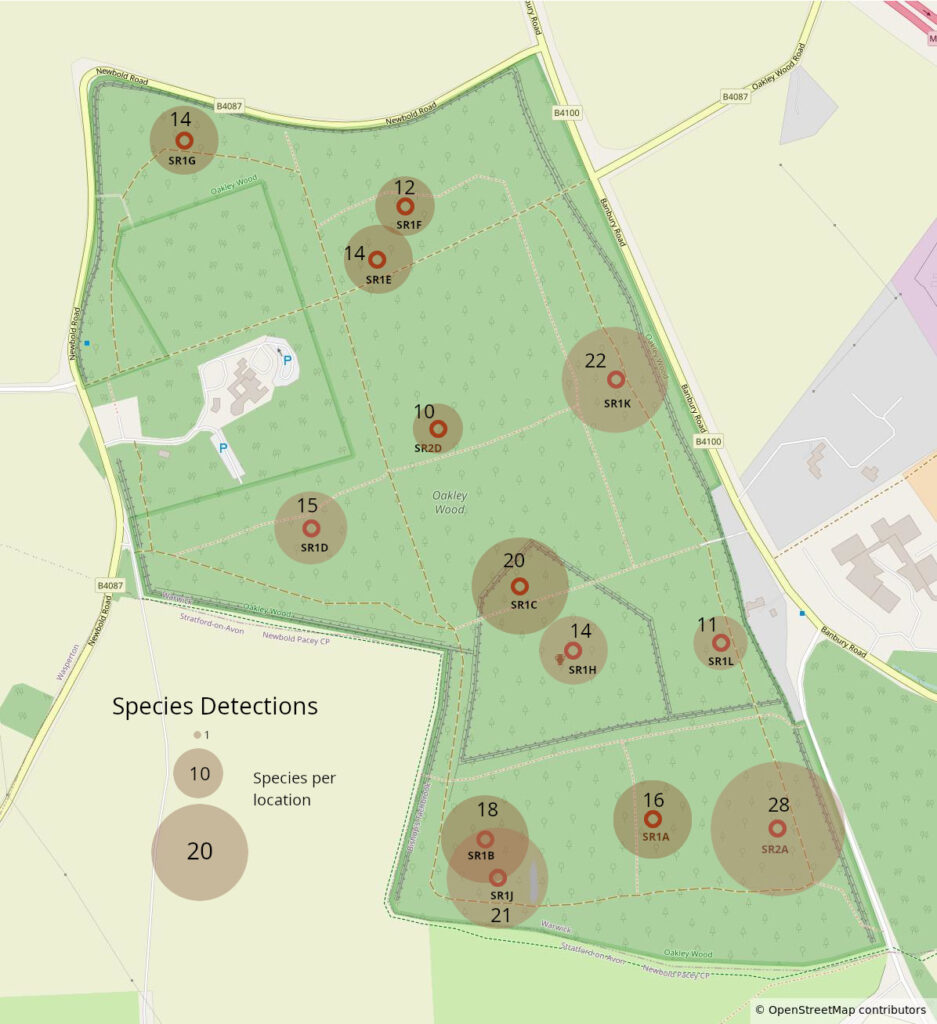
Firstly, for each location, the map below shows the number of species detected, ignoring ones that have a detection rate lower that 0.1 per hour (an arbitrary number). This could be interpreted as how species-rich particular parts of the wood are.
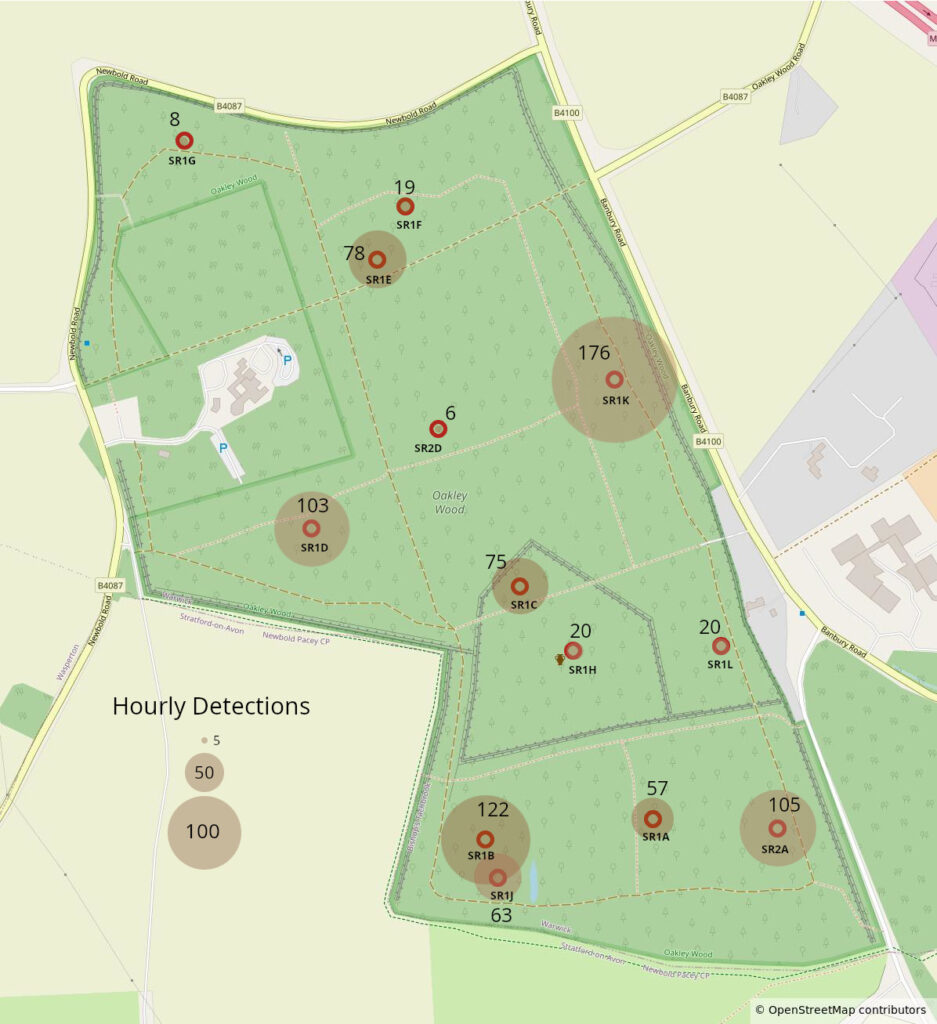
Then we can look at how frequently birds are detected at the various locations, so ignoring the species and concentrating on the total number of birds (more precisely, their calls or songs). We can interpret this as how bird-rich particular parts of the wood are:
I could create a separate map for detections for each species, but that’s quite a bit of work. Instead, the raw numbers are here for the inquisitive to consume. These raw numbers include some low occurrence, almost certainly false identifications, so don’t get excited when you see species such as Whimbrel or Spotted Crake. Some known false identifications (“false positives”) automatically get substituted during the analysis and these are noted. The file names at the top of each location data set are the folders that hold the recordings for that location. You’ll notice that location SR2A has lots of folders – this is because the recorder was there for a long time with the intention of tracking birds throughout the seasons..
A brief description of the various locations shown on the map is here.
The figures here give us a sort of base line for birds in Oakley Wood. If recording is continued into the future (which I intend to do) it may tell us how the work of managing the wood is affecting the bird life.
Chris